A governmental report was released recently by the Nanyang municipal statistics bureau, demonstrating changes that have taken place for the city over the past 15 years across four major categories—area and population, housing and supplies, GDP and industrial proportion, health care and urban environment.
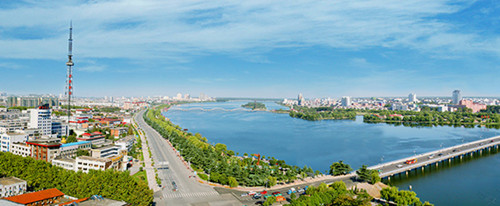 |
| An aerial view of Nanyang. [Photo/nanyang.gov.cn] |
Area and population
The land urban area covered 70 square kilometers in 2000, and 640.77 square kilometers in 2015, a total increase of 570.77 square kilometers, an average annual increase of 15.9 percent.
The built-up area was 37 square kilometers in 2000, and reached 149.45 square kilometers in 2015, a total increase of 112.45 square kilometers, an average annual increase of 9.8 percent.
The urban population was 59.8 million in 2000, and increased to 124.72 million in 2015, an average annual increase of five percent. As for urban population of the city's total population, the proportion was 5.7 percent in 2000, and increased to 10.5 percent in 2015, a rise of 4.8 percent.
Housing and daily supplies
The per capita living space of urban residents was 32.66 square meters in 2015, an increase of 12.71 square meters compared with that of 2000.
Family vehicle usage rate in 2015 was 45 times higher than 2000, while refrigerators clinched an increase of 54.8 percent, and the usage rate of cameras in 2015 was 5.7 times higher than in 2000. As to high-end musical instruments, 2015 saw a 55.6 percent increase in use over 2000.
In 2015, mobile phone users reached 6.7 million, meaning 200 mobile phones for every 100-household township, 154 more than 2000, an increase of 340 percent.
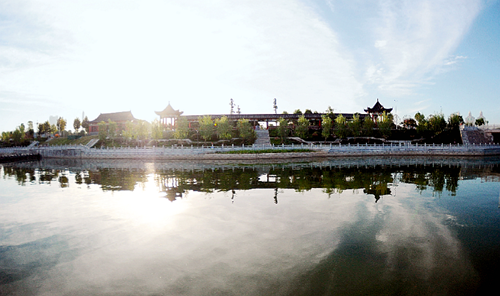 |
| Baihe River in Nanyang. [Photo/nanyang.gov.cn] |
GDP and Industrial proportion
The GDP of municipal districts was 12.82 billion yuan ($1.86 billion) in 2000, and reached 66.69 billion yuan in 2015, reaping an increase of 420 percent (without deduction of price factors), with an average annual increase of 11.6 percent.
From 2000 to 2015, the proportion of primary industry decreased by 8.4 percent. The proportion of secondary industry decreased by 15.9 percent, while the proportion of tertiary industry increased by 24.2 percent.
The changes of industrial proportions indicate that urban economic development momentum gradually shifted from primary industries to the tertiary industries.
Health Care and Urban Environment
In 2000, the city had 364 health institutions, with 14,870 beds and 29,203 working members. In 2015, there were 433 health institutions in the city, an increase of 19 percent, with 50,394 beds, an increase of 240 percent, and an extra 41,884 working members.
The city's green area was 872 hectares in 2000, and the area reached 3,825 in 2015, an increase of 340 percent.
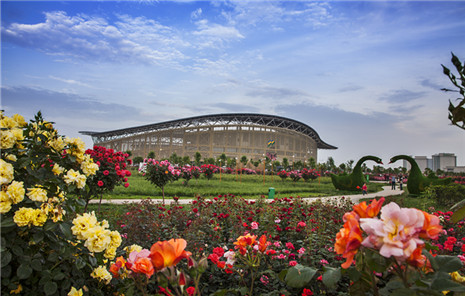
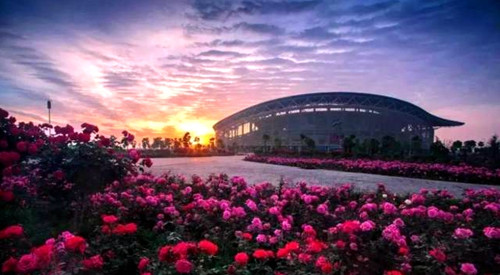 |
| Rose exhibition in Nanyang. [Photo/nanyang.gov.cn] |

Nanyang clay sculpture works win gold medals at the Sixth Central Plains (Hebi) Cultural Industries Fair.